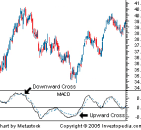
A trend-following momentum indicator that shows the relationship between two moving averages of prices. The MACD is calculated by subtracting the 26-day exponential moving average(EMA) from the 12-day EMA. A nine-day EMA of the MACD, called the "signal line", is then plotted on top of the MACD, functioning as a trigger for buy and sell signals.
There are 3 common interpretations of trends found from MACD: 1) crossovers; when MACD falls below the signal line it is a bearish signal(price will fall), if it rises above the signal line(prices will rise). 2) divergence; when the security price diverges from the MACD it signals the end of the current trend. 3)dramatic rise; when the MACD rises dramatically, its a signal that the security is overbought and soon will return to normal levels.
- 품사: noun
- 분야/도메인: 금융 서비스
- 카테고리: Financial instruments
Other terms in this blossary
작성자
- Timmwilson
- 100% positive feedback
(Beijing, China)


